How Ad Quality Impacts Churn

Mobile developers are well aware that ads can be both a significant revenue driver and a potential risk to user experience. However, ads that behave like unwanted guests - redirecting users unexpectedly, popping up at the wrong time, or trapping them in loops - can cause far greater damage than just lost ad revenue. Poor ad quality is a significant detriment to your game. It not only annoys players but actively drives them away, leading to a shrinking active user base, a collapse in retention metrics, and an overall erosion of player trust.
In this article, our goal was to quantify what often goes unmeasured: how different ad networks impact real player behavior - from click patterns and session abandonment to churn weeks after exposure. We’ve analyzed data drawn from a unique dataset using Unity’s AdQuality tool across multiple games, platforms (Android + iOS), and ad formats (rewarded and interstitial) in November 2025 - clearly showing that not all ad partners are created equal.
Why Ad Quality Matters
We can all agree that the quality of ads served within the games is deteriorating day by day in many different ways. Ads are becoming ridiculously long and new parts of the ad template are making it harder than ever to complete and exit the ad. There are no universal patterns for buttons and clickability for all ad networks and redirects to app stores are mostly forced one way or another. Without even looking at the content itself (which we will leave for the next story), ads can be overwhelming for users and cause them to quit the game, sometimes even for good.
To keep an eye on ads that could potentially harm your user experience, you should monitor metrics per advertiser or better yet, creatives that indicate problematic behavior and block them if needed. To do so, we started using Unity’s AdQuality tool which helped us track many bad apples. We’ll be talking about churn rate, click-through rate, ad escape rate and auto clicks. If you have any doubts about definitions for any of these, you can find the exact explanations here.
Research Methodology
Since each ad network has its own specific ad template, we wanted to see how its user experience translates to the above-mentioned metrics. Data was collected for multiple titles that we’re managing, and the breakdown was done by the ad network.
- Games analyzed: Multiple titles under our monetization portfolio, spanning casual and midcore genres.
- Platforms: Both Android and iOS.
- Ad formats: Interstitials and rewarded videos.
- Time period: Entire month of November 2025.
- Data source: Unity’s AdQuality tool.
What do you think which ad network has the most user (un)friendly ads? 😏
What are the numbers saying?
Let’s examine some examples of the analyzed games to see how these metrics vary depending on the game, ad format, and ad networks included. Top critical results are highlighted. If you want to see data from all games that we’ve analyzed, feel free to reach out!
Rewarded video ads - Android
Let’s examine some examples of the analyzed games to see how these metrics vary depending on the game, ad format, and ad networks included. Top critical results are highlighted. If you want to see data from all games that we’ve analyzed, feel free to reach out!
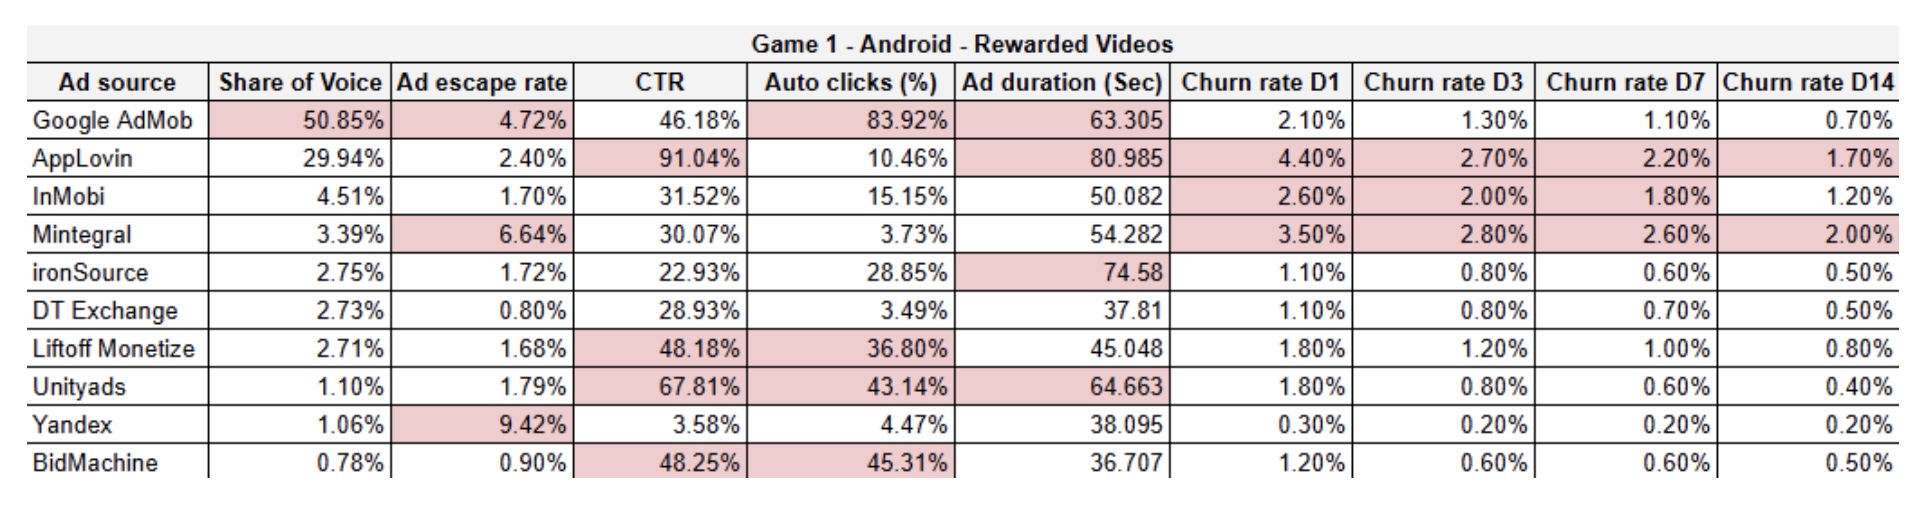
Applovin leads in CTR (91%!), ad duration and churn rates. Google AdMob’s auto clicks (84%) look alarming here but this is an excellent example of the unreliability of this metric. Google AdMob is showing their specific end cards and overlays that can be flagged as auto clicks, but in reality they are not.
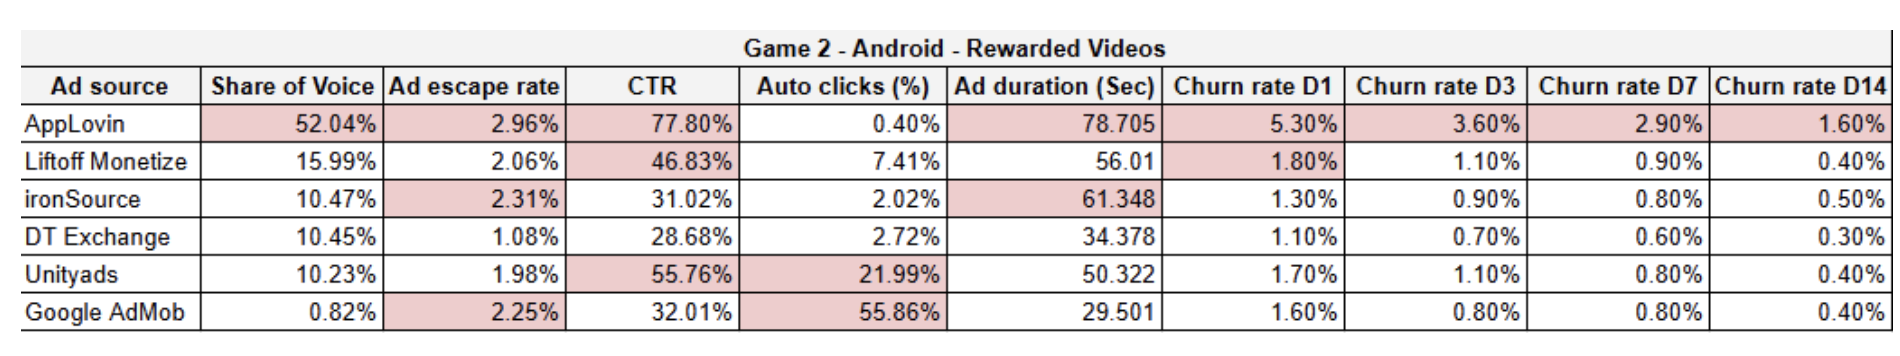
In this game, Applovin takes more than 50% of total impressions, CTR is 78%, and churn rate D1 is 5.3%. Even though some other networks also have higher CTR (UnityAds, Liftoff Monetize), churn rates are not even close to the ones we see on Applovin.
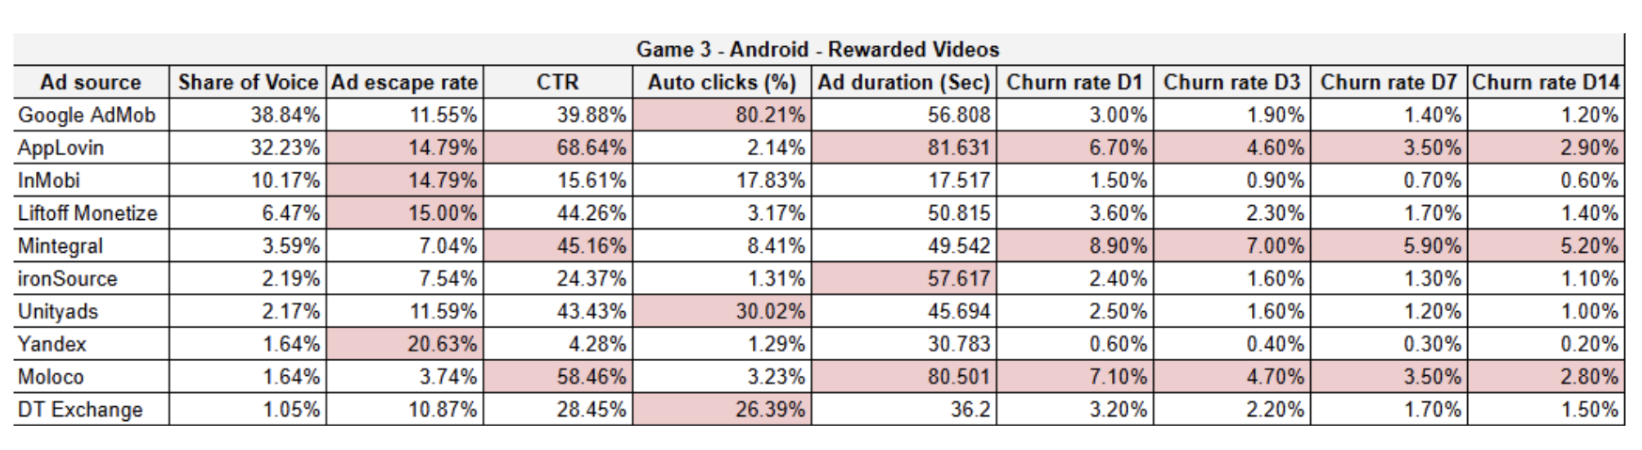
The situation is different in the last game, with Mintegral taking over with the highest churn rates, followed by Moloco and then Applovin.
Overview:
- Applovin dominated the CTRs being incredibly high in all games (up to 91%!).
- When it comes to ad duration, Applovin, Moloco, ironSource, and UnityAds had ads that users watched longer than 60 seconds on average.
- Even when we had the same networks within the games, churn rates differed a lot. The main reason for this is the nature of the games, their users’ behavior and ad tolerance. The lowest churn rates were in mid-core game while the highest ones were in a hyper-casual game.
Rewarded video ads - iOS
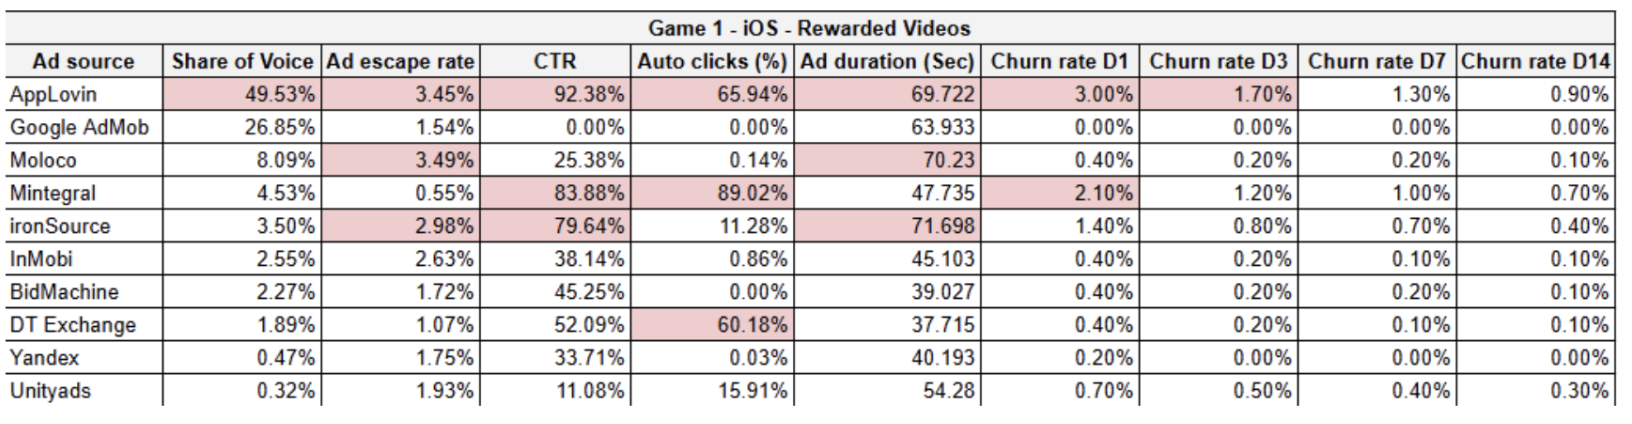
With a CTR of 84% and auto clicks of 89%, Mintegral is right behind Applovin when it comes to churn rates.
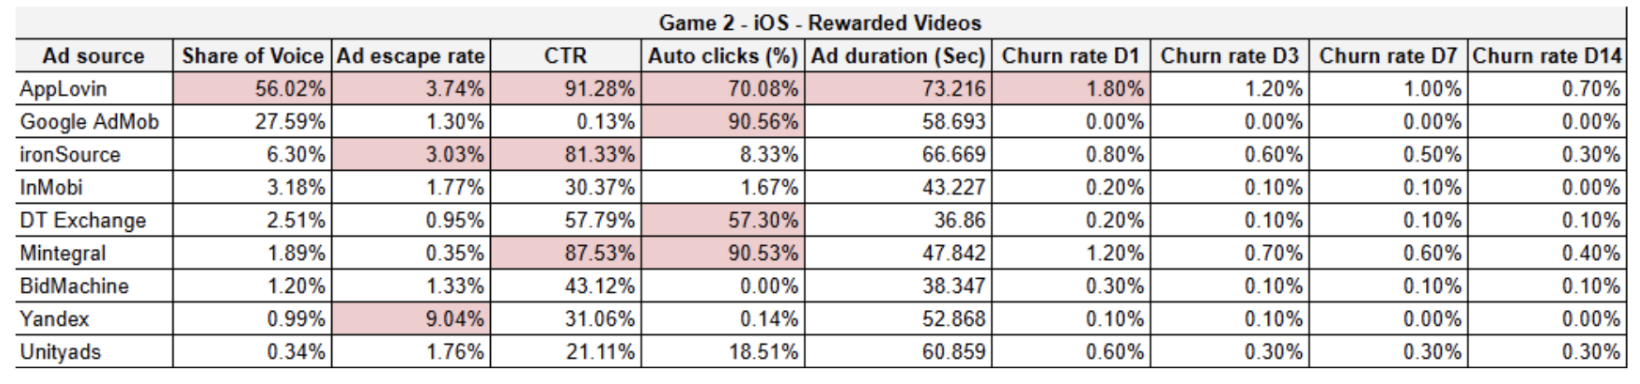
Interesting example where metrics are suggesting bad UX but churn rates are not validating it.
Overview:
- Applovin still has the highest CTRs.
- When it comes to ad duration, Applovin, Moloco, ironSource, and Liftoff Monetize had ads longer than 60 seconds on average.
- The highest churn rate was 5% for D1 on iOS, while on Android it went up to almost 9%. We can see that there are differences in the metrics when it comes to the platform as well.
Interstitial ads - Android
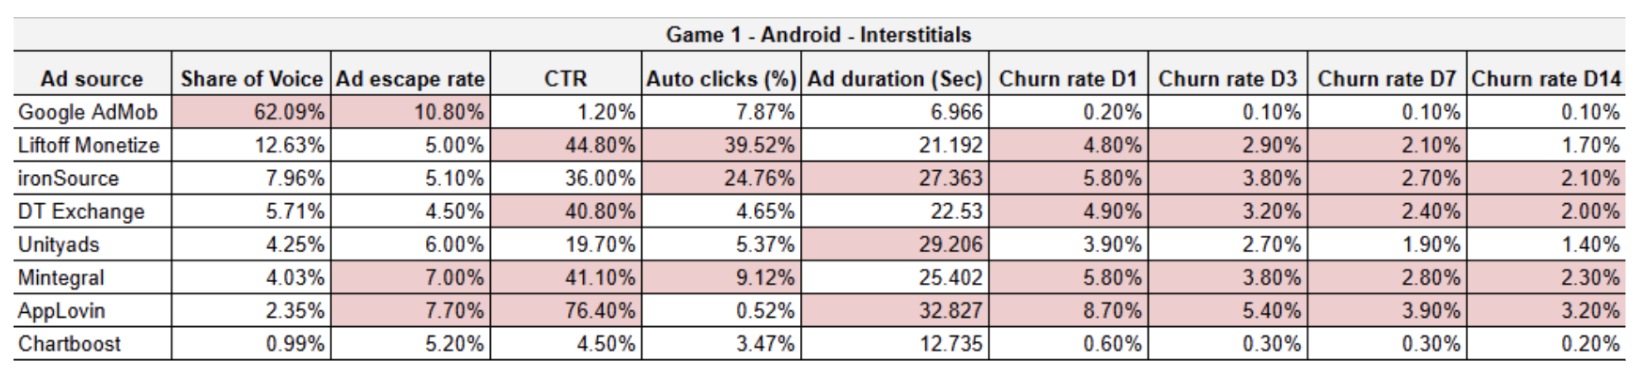
Churn rate for interstitial ads is similar on most of the networks. Applovin is still the champion with 8.7% D1 churn rate, while everyone else besides Google AdMob and Chartboost keeps it between 4% and 6%. Interstitial ads are supposed to be skippable after 5 seconds, right?
With 50% share of voice, churn rates seem too high. We’re looking at 12.1% for D1, 9.7% for D3, 8.4% for D7 and 4.5% for D14. DT Exchange is very close behind Applovin this time.
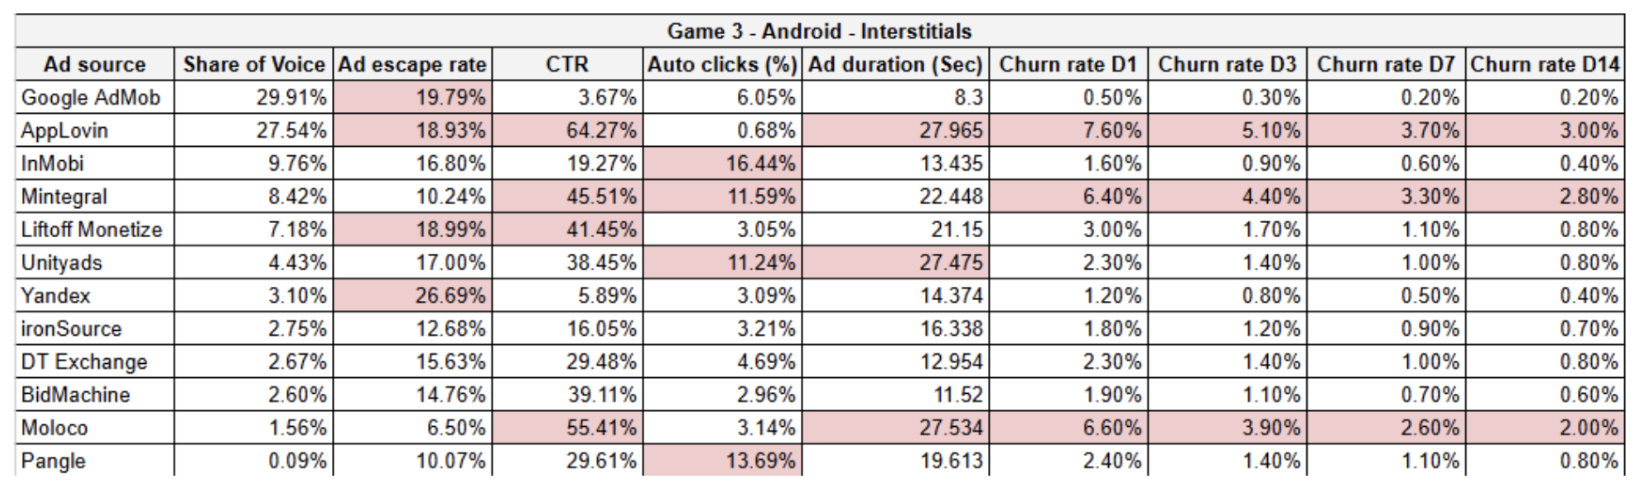
Applovin, Moloco and Mintegral have even up to 15 times higher churn rates compared to the other 9 networks.
Overview:
- Applovin still has the highest CTRs that go even 20% higher than the next highest value.
- Most of the ad networks were showing ads longer than 15 seconds, which is the default ad duration for AdMob’s high-engagement ads.
- Churn rates are significantly higher for interstitial ads than for rewarded videos. This is expected, as interstitials are a more intrusive format that some users find intolerable. However, even within this format, certain networks show much higher churn than others, with differences reaching as much as 15x.
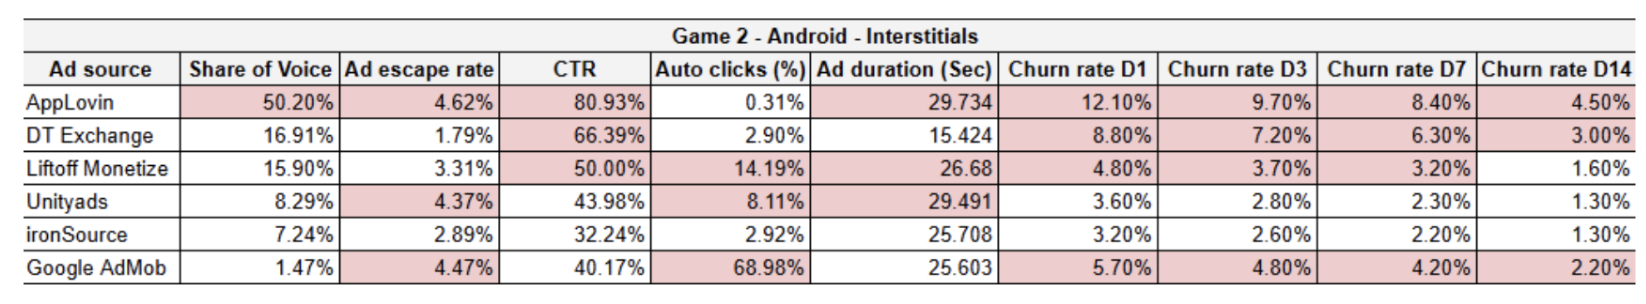
Interstitial ads - iOS
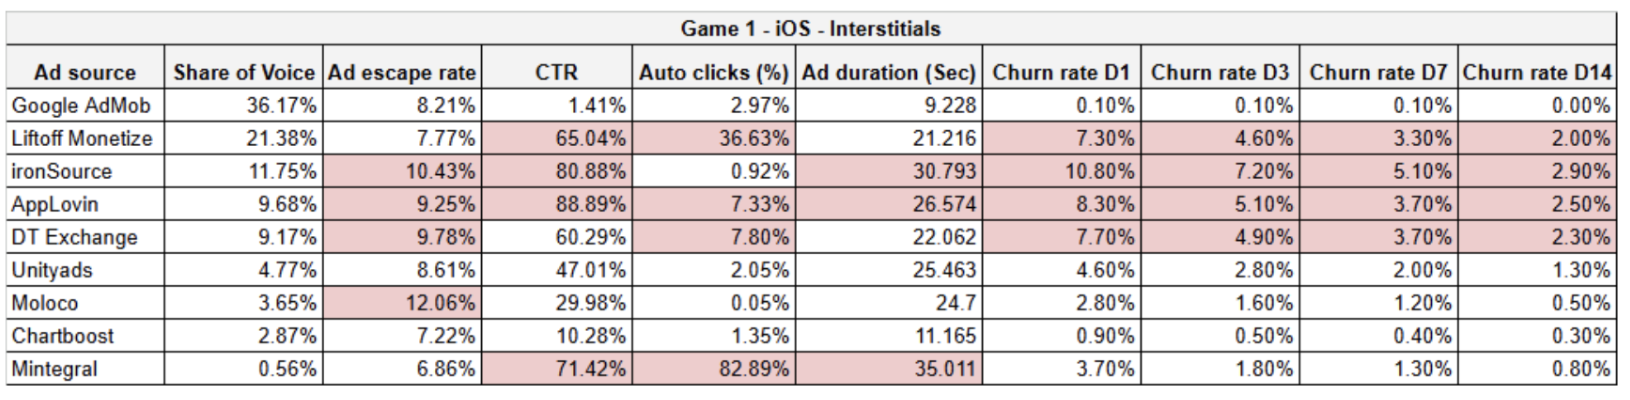
Similar to Android, churn rates are much higher than for rewarded video ads. This time ironSource took the lead.
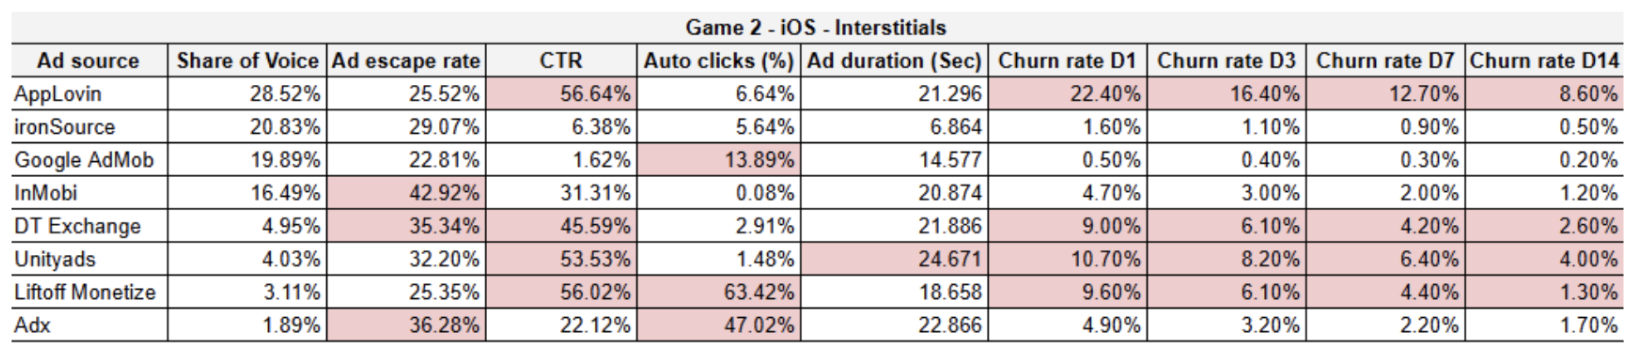
Even though Applovin doesn’t have the worst values of the metrics in this particular case, churn rates caused by their ads are higher than in any other comparison, and they go from 22% on D1 to almost 9% on D14.
Overview:
- CTRs are much higher for all ad networks this time.
- Most of the ad networks were showing ads longer than 20 seconds.
- Churn rates are significantly higher for interstitial ads than for rewarded videos on iOS as well. Applovin reached a new record and got to 22% churn rate on D1 despite not having the worst UX looking solely at the numbers.
Key Insights
Going table by table, there’s a lot of noise across the different networks and games. But once we aggregate the data, it becomes clear just how problematic some networks are.
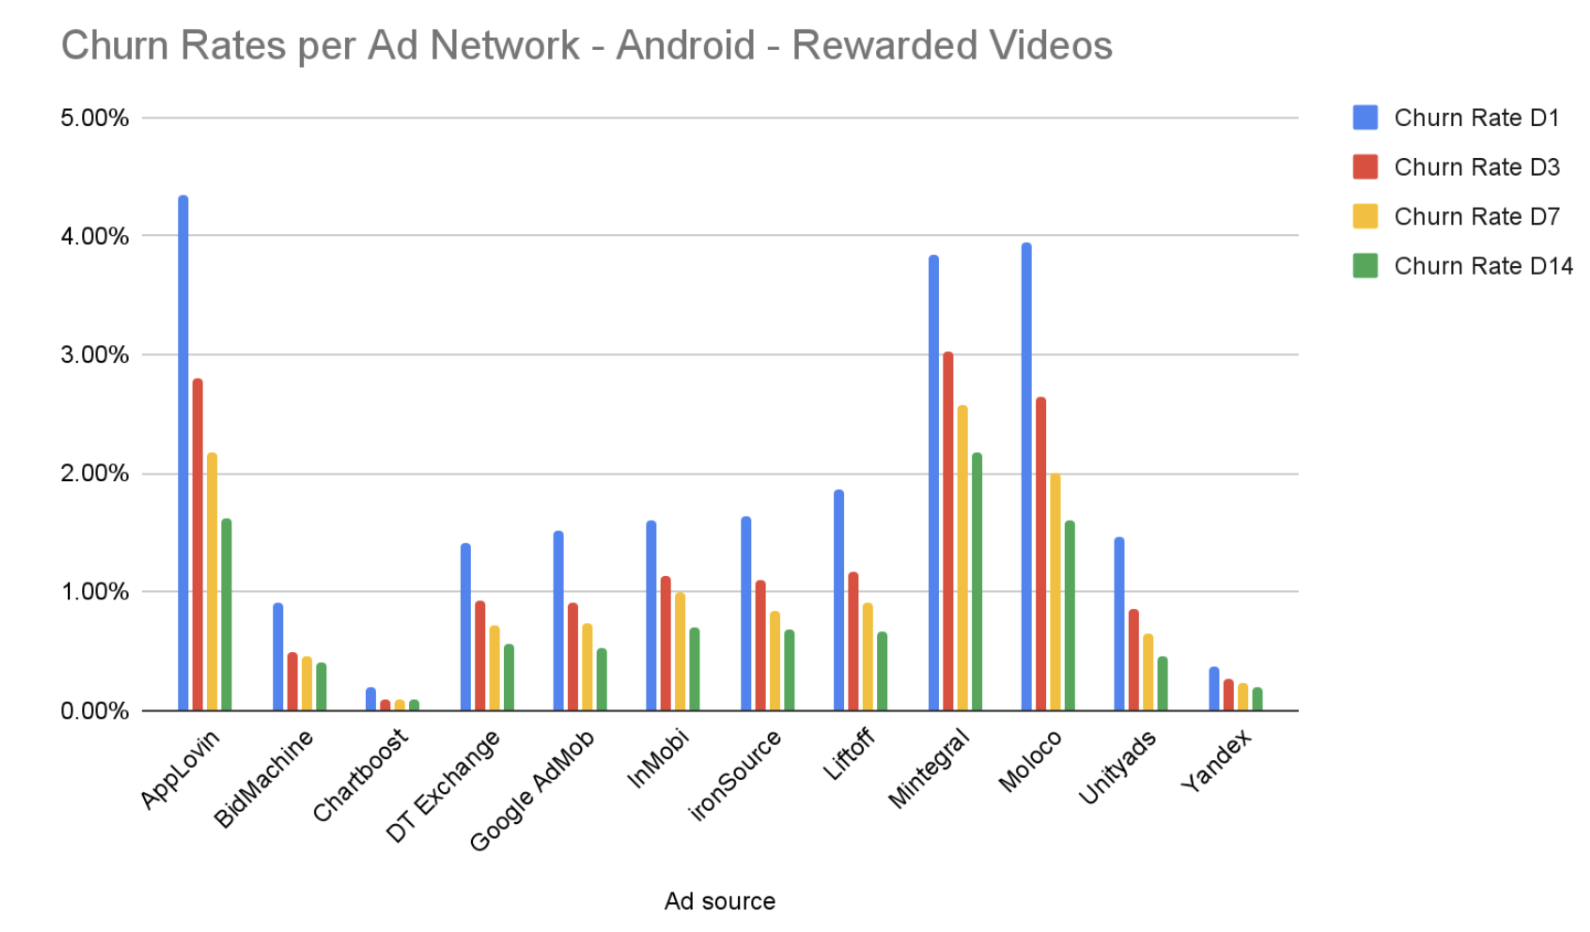
For Android, rewarded videos churn rates are generally moderate, with most networks staying below 2%. AppLovin shows the highest Day 1 (D1) churn, peaking above 4%, while Moloco and Mintegral are right behind it with D1 Churn ~4%.
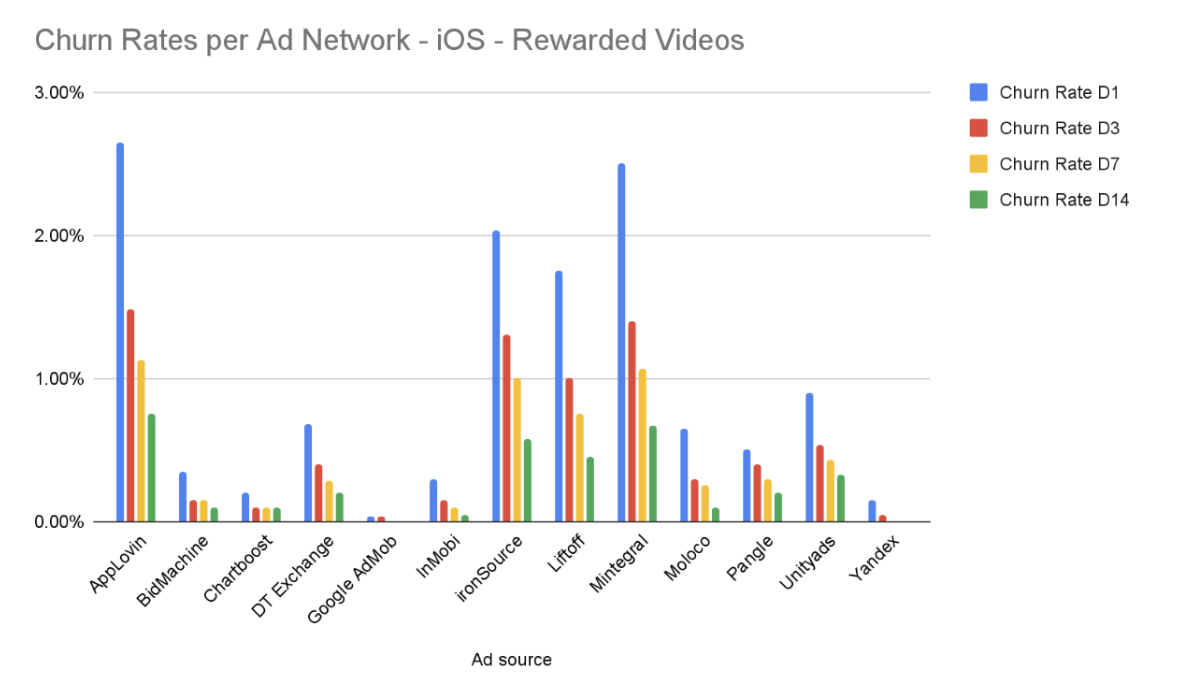
On iOS, most networks are showing churn rates below 1%, while Applovin and Mintegral lead with around 2.5% D1 churn rate. The highest D3 churn rate is coming from Applovin, followed by Mintegral and ironSource.
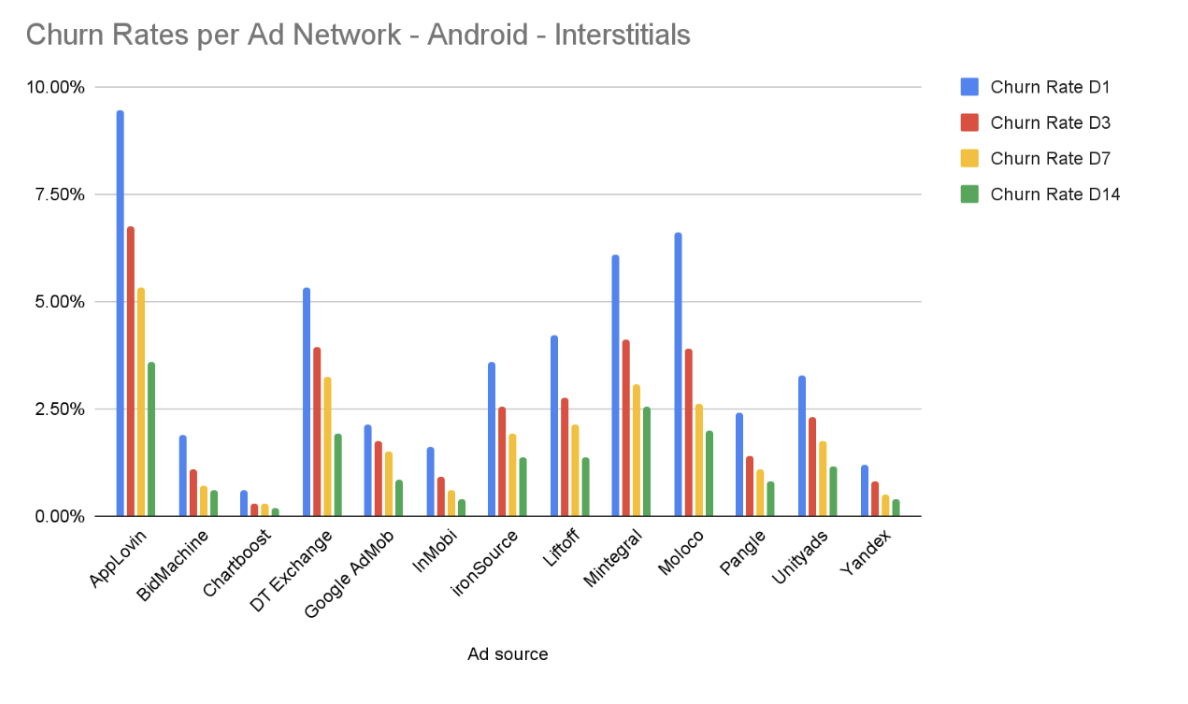
Interstitial ads trigger much higher churn than rewarded videos. AppLovin is the most volatile, with a D1 churn rate approaching 10%, while D3 churn rate is ~7%. Networks like Moloco and Mintegral also show elevated D1 churn between 6% and 7%, followed by DT Exchange with 5% D1 churn rate.
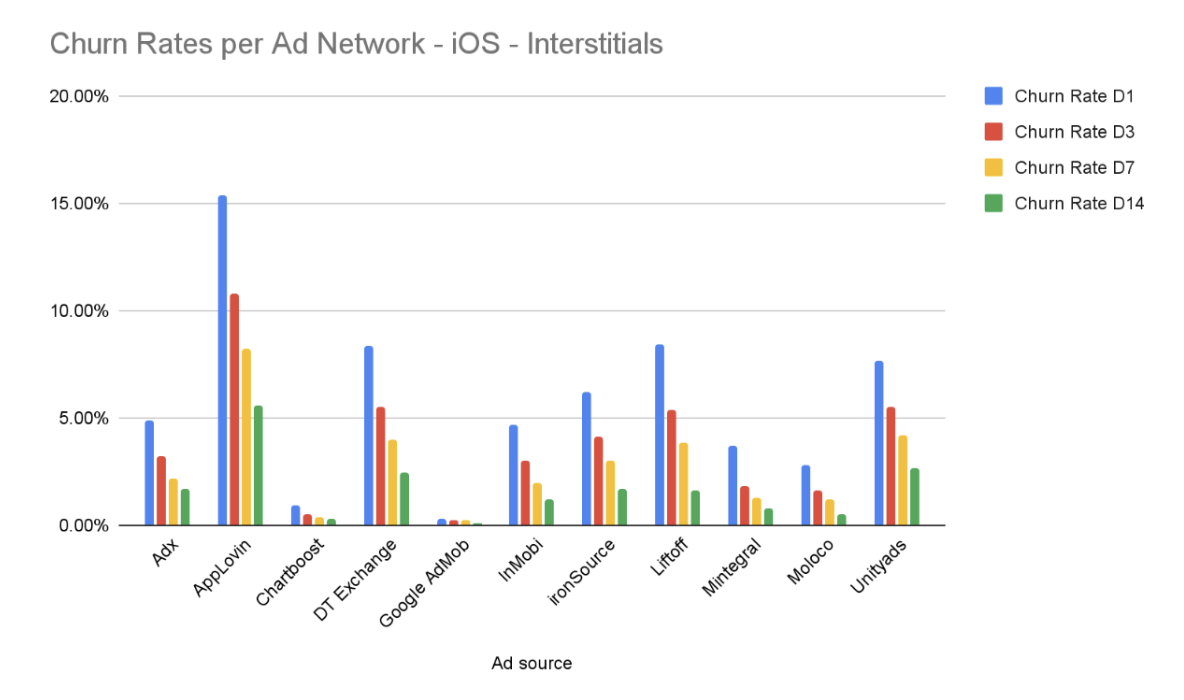
This category contains the highest single churn instance in the dataset. AppLovin reaches a D1 churn rate of over 15% on average. Other major networks like Liftoff, DT Exchange and UnityAds also struggle here, with D1 rates between 7% and 9%. These networks also have the highest D3 churn rate with Applovin leading with almost 11%, followed by DT Exchange, UnityAds and Liftoff Monetize which are all showing churn rate D3 above 5%.
Primary trends regarding user churn and ad exposure based on the data we saw:
- Format friction: As expected, interstitial ads cause significantly higher churn than rewarded videos across all platforms. Regardless, some networks are causing more users to churn than others.
- The "AppLovin" variable: Across both Android and iOS, and both ad formats, AppLovin consistently shows the highest initial churn rates. For interstitials on iOS specifically, it is the most aggressive of all and goes over 20% for some of the analyzed games.
- Platform disparity: iOS users appear to be more sensitive to interstitial ads than Android users, as evidenced by the higher peak churn percentages (15%+ on iOS vs. ~10% on Android). Conversely, iOS Rewarded Videos generally perform better than their Android counterparts.
- Retention leaders: Chartboost and Google AdMob consistently maintain the lowest churn rates across almost all categories, indicating these networks may provide a better user experience.
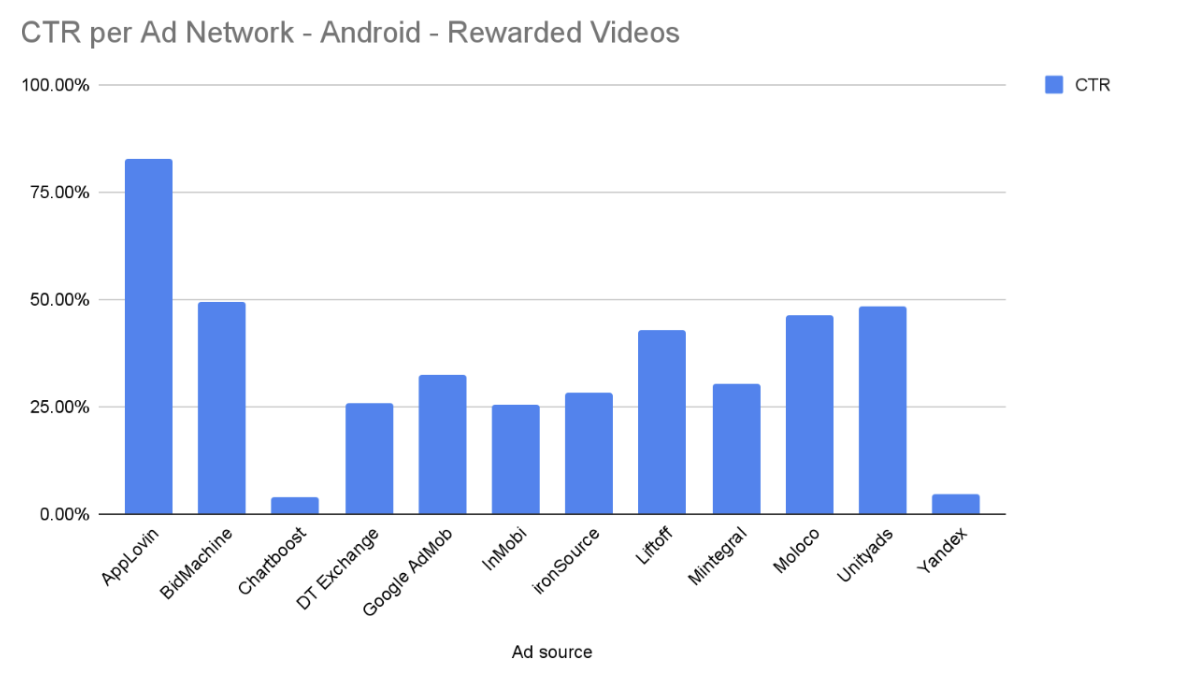
AppLovin is the clear leader on this platform, reaching an 80% CTR. BidMachine and Moloco follow as strong performers, maintaining rates between 45% and 50%. Similar to iOS, Chartboost and Yandex show minimal engagement, both under 10%.

On iOS, performance is dominated by AppLovin and ironSource, both exceeding an 80% CTR. Mintegral also shows strong engagement at approximately 70%. Conversely, Google AdMob and Chartboost record the lowest engagement, with AdMob’s CTR going below 5%.
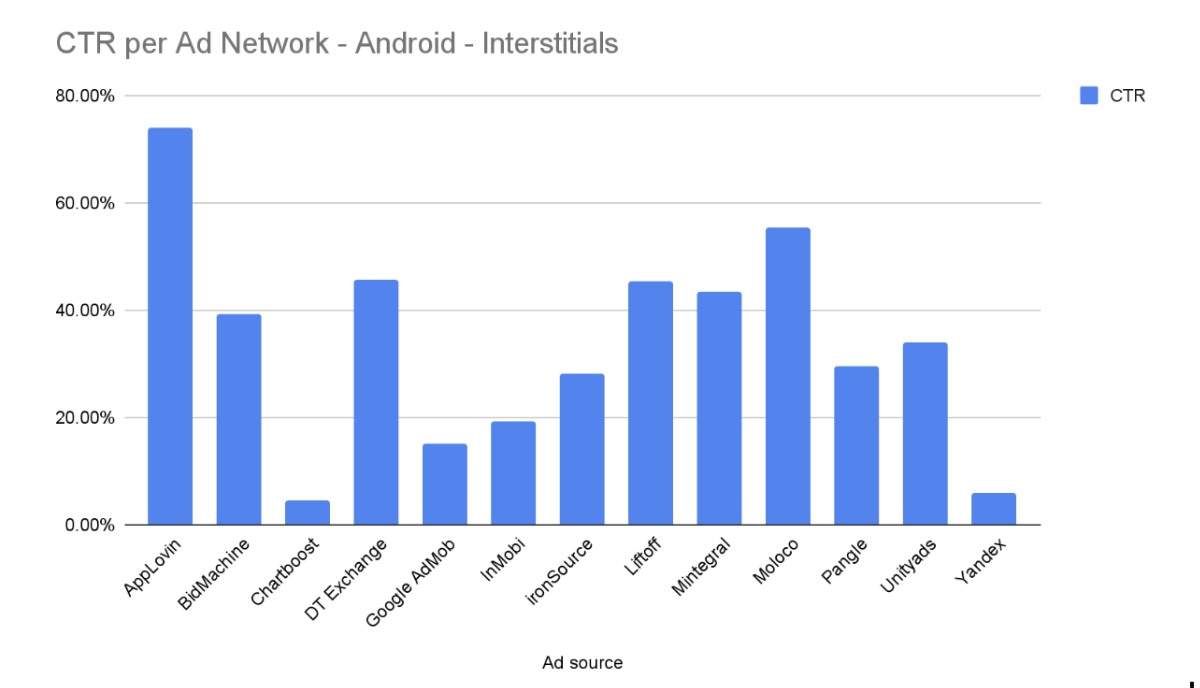
AppLovin again takes the top spot with a CTR of roughly 73%. Moloco shows high comparative performance at approximately 55%, followed by DT Exchange and Liftoff, which both hover near 45%. Chartboost and Yandex remain at the bottom of the rankings.
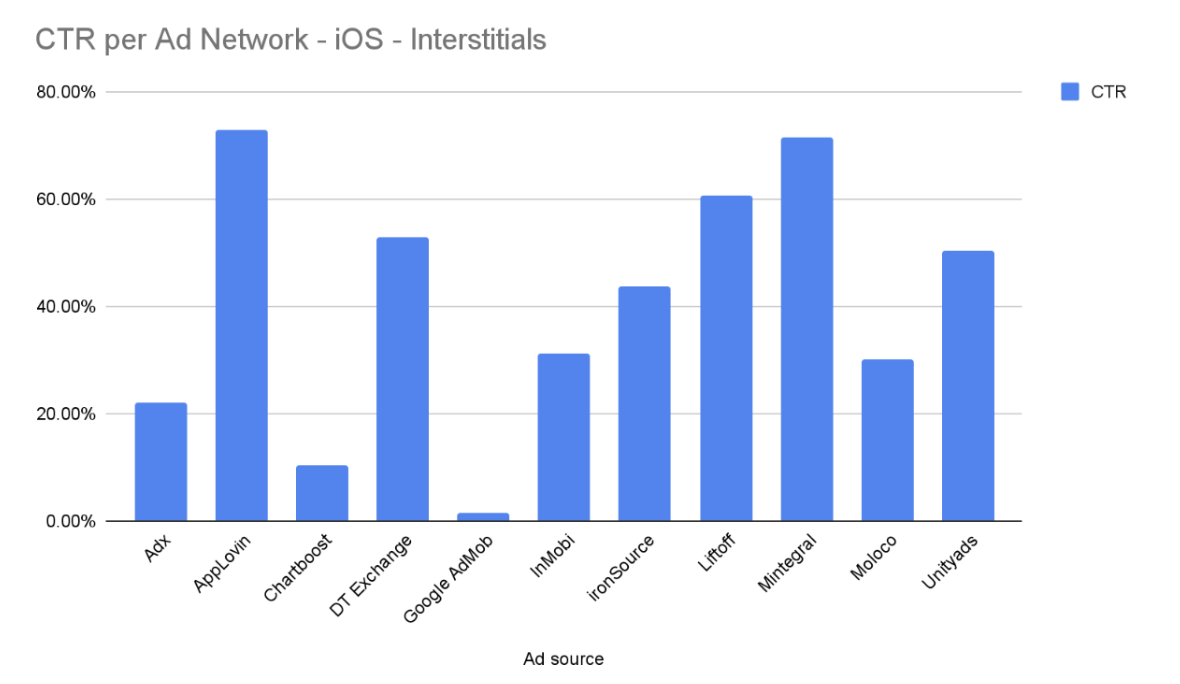
Liftoff and DT Exchange are behind them, staying within the 50% to 60% range. Google AdMob remains the lowest performer, barely registering on the scale.
How do these networks differ when it comes to CTR:
- Highest CTRs: Applovin is again the most consistent, having extremely high CTRs that even go above 90%. Depending on the platform and ad format, Mintegral, Moloco, ironSource and BidMachine are following. In each category, at least one network has a CTR above 70%.
- Connection to churn rates: For most of the networks mentioned above, we see that at least in some categories their churn rates were higher as well. On the other hand, the lowest churn rates were for Chartboost and AdMob, which are also showing the lowest CTRs.
Friend or Foe?
Depending on the creatives themselves that end up within the game, we see that poor ads can come from any ad network. However, some of the discussed metrics are a consequence of the way specific ad templates work and their user interface.
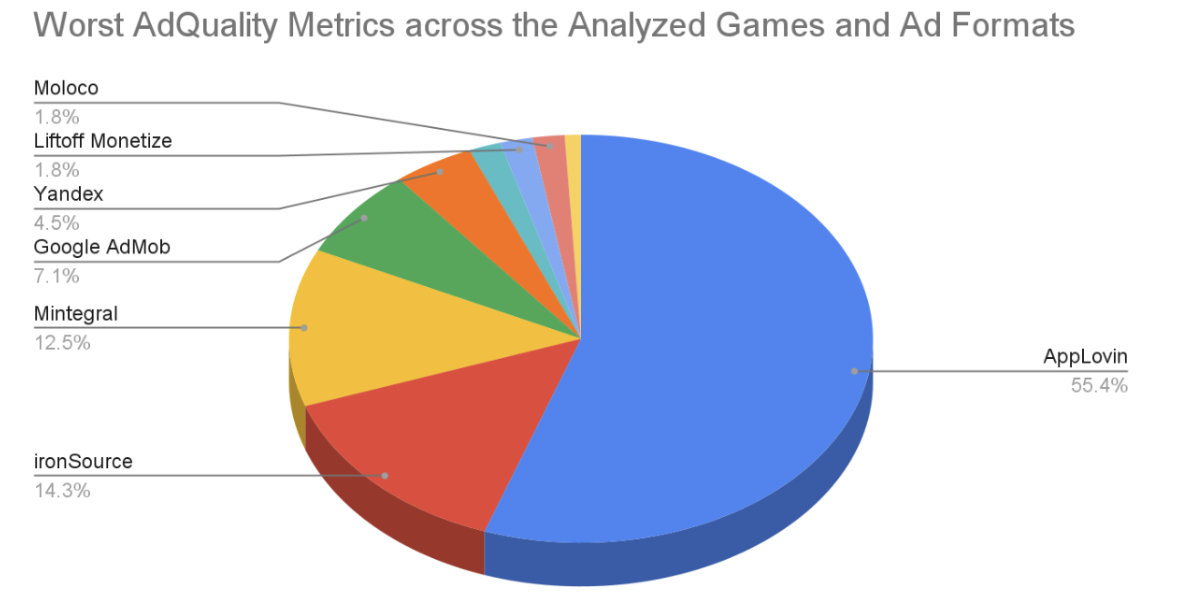
If we look at all of the metrics for all games and ad formats together, let’s see how many times each ad network had the worst values. Surprised or not, Applovin “won” the worst performance in more than 50% of cases. It looks like Applovin is not only dominating the stock market. 😜
When it comes to CTR, Applovin has the highest values in 13 out of 14 cases. Their Ad Duration is also the highest in 11 out of 14 cases. It’s not surprising that the Churn Rates are also the highest for Applovin in more than half of the cases.
Ad monetization in mobile games is often optimized for the obvious revenue generators - number of impressions and the eCPMs. But as this research shows, players experience ads very differently than dashboards do. They don’t see CTRs or eCPMs - they feel interruptions, frustration, confusion, and, in the worst cases, loss of control.
Across the games we analyzed, a consistent pattern emerged. Ad networks that appeared highly performant on the surface often carried hidden costs. Extremely high click-through rates were frequently paired with elevated churn after the ad interaction. In other words, what looked like engagement was often accidental - and what looked like monetization quietly translated into player loss.
This is where ad quality becomes a strategic concern rather than a technical one. Every ad shown inside a game is effectively an extension of the game itself. When an ad freezes, redirects unexpectedly, or is difficult to close, players don’t separate that experience from the game - they attribute it to the developer. Over time, these moments accumulate, destroy trust and ruin the experience that keeps players coming back.
The encouraging takeaway is that this problem is measurable - and therefore manageable. Tools like Unity’s AdQuality make it possible to move beyond revenue-only optimization and toward experience-aware monetization. It would be even better if you could track this data internally since that would be more reliable and customizable. By examining metrics such as churn after ad interaction, ad escape rates, and auto-click frequency, internal events that would signal any technical issues caused by ads from certain ad networks, teams can identify which partners and creatives are truly aligned with long-term player retention.
Reading this, you might have a knee-jerk reaction: why not just remove the problematic networks? The reality is more complex. Even with their flaws, some networks deliver performance that is impossible to ignore - almost no studio can afford to completely opt out of big players like AppLovin. The answer isn’t sweeping cuts, but precision. Blocking a handful of harmful creatives, segmenting traffic to protect your most valuable users, and enforcing stricter ad templates can meaningfully reduce damage without sacrificing scale.
The ad market is messy, but your game doesn't have to be. With the right controls, you can control the chaos - minimizing the damage to retention while maximizing value from the networks.
This article was written by Ivona Pinjak and originally published as part of the GameBiz Ad Monetization Newsletter. You can read it at this link.
You might also like


Home of the Gamesforum events series and leading mobile game analysis. Discover everything you need to know about mobile games marketing and monetization.